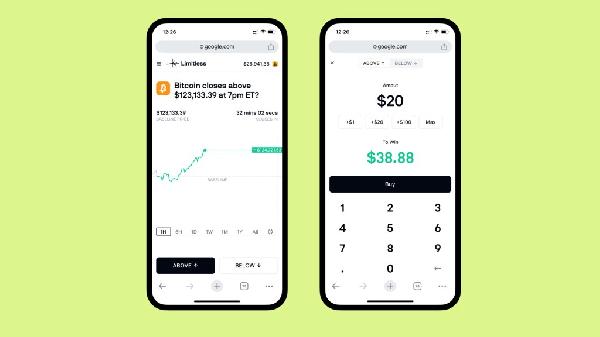
Will the price of Bitcoin close above $108,000 by the end of the week? That’s the question put forth to users of the prediction market Myriad, and traders currently find themselves in a nail-biting position with just days remaining.
Just yesterday, it seemed like a sure fire bet that Bitcoin would stay above the threshold by the July 4 deadline, with Bitcoin trading at around $107,640. The flagship cryptocurrency needed a mere $360 move—just 0.33—to hit the target. The odds on Myriad at the time were split, just about 50-50, with bears only slightly winning out at 50.8.
Today, with Bitcoin now trading around the $106K market—a key price point to watch in the month of July—the odds on Myriad have moved dramatically. Predictors on Myriad now place the odds at 69 that Bitcoin won’t be priced above $108,000 by July 4, ending the week on a bearish trajectory. (Disclosure: Myriad is a prediction market developed by Decrypt’s parent company Dastan.)
So what do the charts say about Bitcoin’s next move?
Bitcoin price: What the charts say
 Bitcoin price data. Image: TradingView
With Bitcoin dancing just below the $108K psychological barrier, the question on Myriad isn‘t whether it can touch $108,000 by week’s end, but whether it can close above it—and that’s a crucial distinction.
Using four-hour windows, Bitcoin has only managed to close above the $108K mark three times in the last 30 sessions since June 25. Prior to this, the last time Bitcoin closed the day above $108,000 was June 9—and for what it’s worth, it has only closed its daily candlesticks above that threshold eight times in its entire history.
For day traders, though, the 4-hour timeframe provides crucial insights for this short-term prediction:
 Bitcoin price data. Image: TradingView
From a purely technical perspective, Bitcoin faces a classic case of "so close, yet so far." The four-hour chart shows multiple attempts to breach the $107,500-$108,000 zone, each met with rejection. These failed breakouts have left telltale wicks on the candles—evidence of buyers pushing prices up, only to be overwhelmed by sellers defending the resistance.
The proximity to the target is deceptive. While a 2 move sounds trivial in crypto markets known for 3-5 daily swings, the repeated failures at this level suggest something more is at play. For position traders, a successful move passing this barrier would mean that bulls have enough strength to push for a new all-time-high price sometime in the near future.
The Average Directional Index, or ADX, reads 17, significantly below the 25 threshold that confirms trend strength. This weak reading suggests Bitcoin is drifting rather than trending—problematic when trying to break established resistance. Low ADX environments typically see prices ping-pong between support and resistance rather than breaking through decisively.
In this case, the ping pong ball has been bouncing between $107,000 and $108,000 since June 25; some times below this level, and even fewer times over it, but always going back to the horizontal channel, confirming that there is no clear short-term trend. In other words, it demonstrates the ADX’s accuracy.
The Squeeze Momentum Indicator shows that markets are pushing for a bearish impulse, indicating downward momentum currently dominates shorter timeframes.
This bearish pressure directly opposes the bullish break needed for the $108,000 target. All this means in simple terms is that traders appear to currently favor a bearish correction rather than a bullish continuation of the long-term trend.
There’s one technical indicator, however, that offers a glimmer of hope: the Exponential Moving Averages, or EMAs. This measures the average price of Bitcoin over a given period of time, and it helps guide what traders decide to do next. Using four-hour windows again, the 50-period EMA sits above the 200-period EMA, maintaining the bullish golden cross structure. This alignment suggests the broader trend remains upward, even if short-term momentum wavers.
That said, prices pushing below the 50-period EMA, showing some bearish pressure in the short term.
Another useful indicator for this bet is the Volume Profile Visible Range. Right now, the price is trading above the point of control, which is usually a bullish sign. However, since the price is also near a resistance level and there’s not much momentum, there’s a higher chance the price could pull back, or "mean revert."
The Volume Profile highlights price zones where the most trading activity has happened—these areas often act as natural support or resistance because traders set their take-profit or stop-loss orders around there. For example, if you buy at a certain price, you might set your stop loss at that same level to protect yourself from losses.
This is slightly bullish (prices are trading over a zone in which a lot of traders bought BTC), however, with weak directionality, it is not enough to consider it confirmation of market sentiment.
The weekend factor
An often-overlooked element is that July 4 falls on a Friday, with the deadline at 11:59 PM UTC—essentially Saturday morning for many global markets.
Weekend trading typically sees reduced institutional participation, lower overall volume, wider bid-ask spreads, and in general only crypto degens are active, since their markets never sleep.
These conditions make sustained breaks of key resistance levels more difficult, as there‘s simply less buying power to overwhelm sellers.
The verdict: touching vs. closing
Based strictly on the charts, Bitcoin does appear to have a high probability of at least touching $108,000 before the July 4 deadline—after all, it needs less than a 2 spike. But closing above $108,000? That does appear unlikely at the moment.
Here‘s why:
Of course, this assumes all things remain equal, and external factors remain constant. But this is crypto, and anything can happen. With Bitcoin perched just 0.33 below the $108K target, even minor catalysts like a single large market order, political announcement, whale movement, or even social media sentiment could dramatically shift the outcome. While charts suggest price resistance will hold, the margin is so thin that traditional technical analysis loses some predictive power with the threshold so close.
Key levels to watch:
- Immediate resistance: $108,000 (the target)
- Critical support: $105,000 (psychological level)
- Next resistance if broken: $110,000 (previous ATH zone)
For prediction market participants, this setup suggests a binary outcome with an edge toward failure based purely on technical factors—probably similar to opening an overly leveraged long position. However, because the deadline so close, external catalysts will likely play a decisive role. Watch for increasing volume and ADX rising above 20 as early signals of a potential sustained breakout, but remain alert to news flow that could render technical analysis temporarily irrelevant.
Your Email


